Managing Dashboards
Objective: Gain an understanding of how to configure and push Dashboard Layouts for users and how to access and configure Widget Tiles.
There are a number of dashboard pages throughout the system. The key dashboard pages include the Home page and the entry page for most modules.
There are multiple types of widgets which can be assigned to a dashboard:
-
KPIs
-
Tabular Data
-
Charts
Each Dashboard is designed using customizable Widget Tiles which display various configured Advanced Search Profiles, which can be saved as sharable Layouts. Other users can then edit their own Dashboards to load a Layout created by another user.
Dashboard Layout
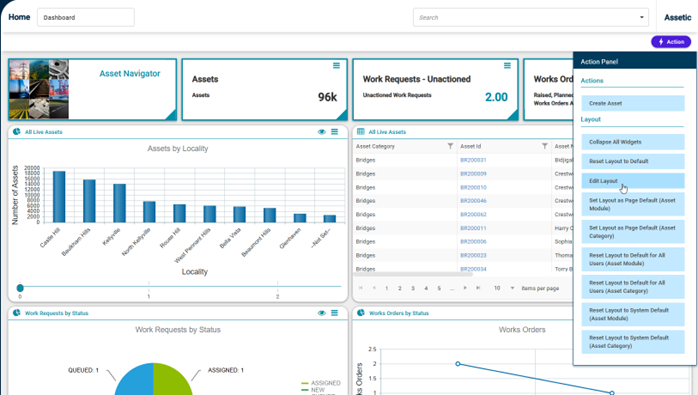
To configure a dashboard, click on ‘Action’ button and select ‘Edit Layout’.
It will show the below screen to select the desired layout:
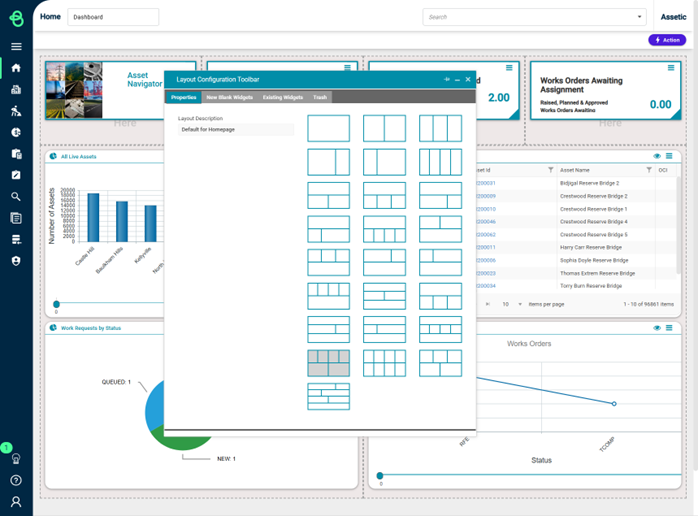
Here users can select the number of rows and columns to use in their dashboard layout.
New Widgets can be dragged and dropped into position on their Dashboard from the ‘New Blank Widgets’ tab, and existing Widgets can be removed by dragging and dropping them to the ‘Trash’ tab.
Once the layout has been selected, users can click on the ‘Action’ button and select ‘Save Layout As’. It will open the below dialog box:
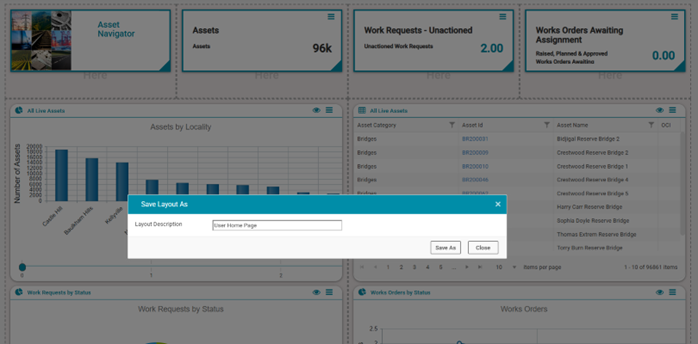
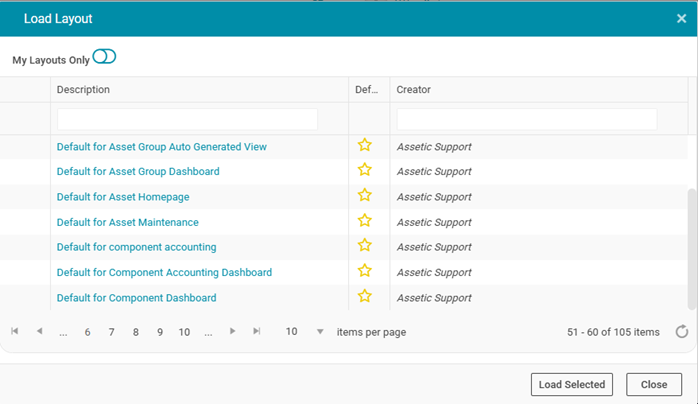
This will save this dashboard under the desired name and make the current user the Layout Owner. Once a Layout has been saved, it is then available when selecting 'Load a Layout' from the Action menu:
Note: System default widgets, such as the Asset Attribute widget on an Asset's home dashboard are shared across all Assets regardless of Asset Category. If instead users want that widget to only show a selected search profile for just one Asset Category, this can be done by editing the layout, dragging the widget to the trash, replacing it with a new widget, and then using the 'Save Layout As' function with a new name.
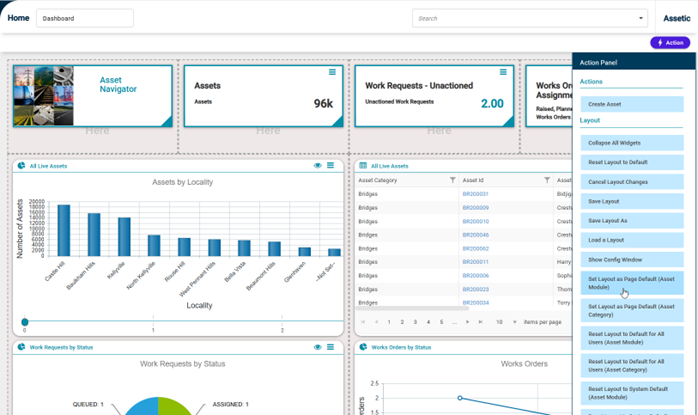
Admin users can push a saved Layout to other users using the Action button and selecting Set layout as Page Default (Asset Module) as shown below:
Widgets can be configured to display saved Advanced Search profiles by clicking the hamburger icon ( ). Widgets configured by Admin users in a layout will also reflect for other users using that layout. Users can also make changes to their own dashboards, at which point any changes made by the Layout owner won’t be visible to them. Only changes made by the owner of a Layout will be propagated to other users of that Layout.
Note: In order for these Advanced Search profiles be visible for other users, please make sure that the ‘Search Sharing’ option is set to ‘Everyone’.
KPI Tiles
An example KPI tile looks like the following:
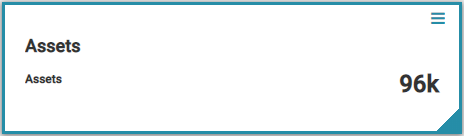
Users can refresh or configure a KPI Tile by selecting one of the options available in the dropdown menu access via the top right corner of the tile:
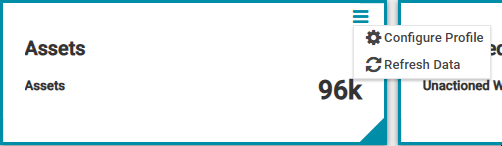
Clicking the KPI tile itself will take the user to the Search Profile's Dashboard page, where they can view the source Advanced Search Profile used to produce the data displayed on the KPI tile.
Tabular Data
An example tabular data tile looks like the following:
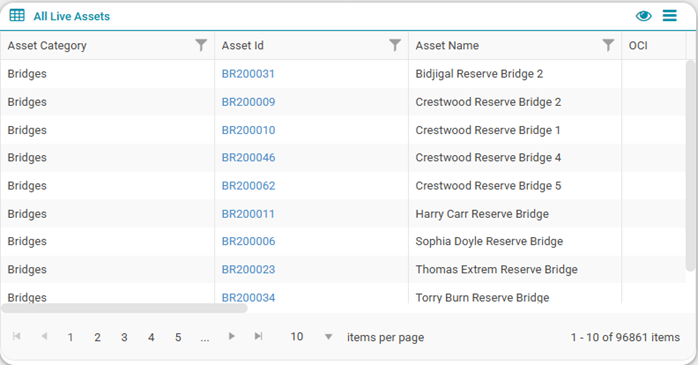
This data comes from the Fields and Filters configuration within the Advanced Search Profile currently assigned to the tile, and columns can be filtered using the filter icon.
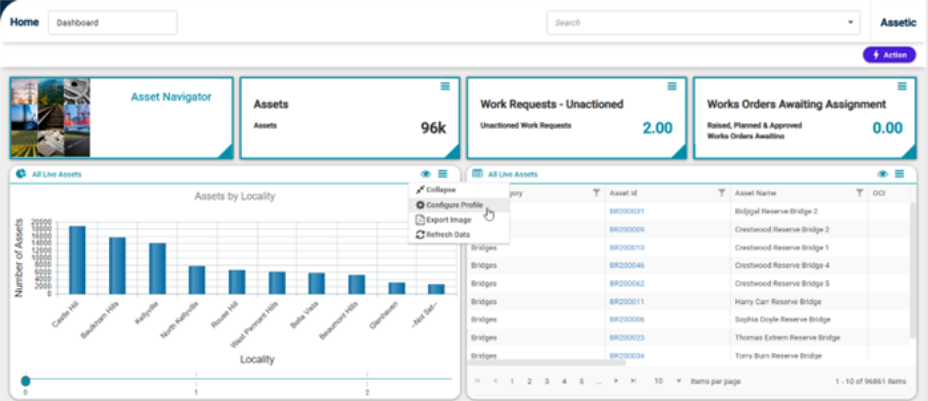
Selecting the Eye Icon ( ) in the top right corner of the dashboard will take the user to the Dashboard page of the source Advanced Search Profile to examine the configuration used to produce the data displayed.
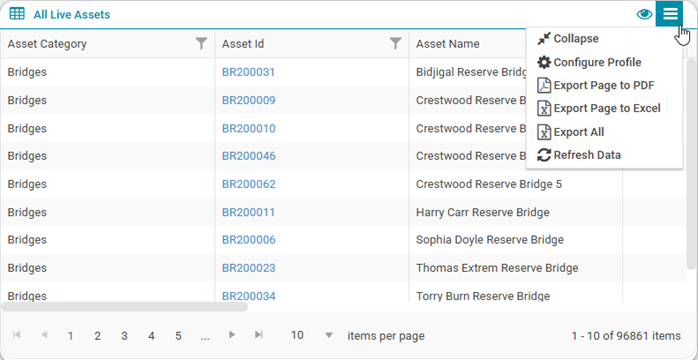
Selecting the " " icon in the top right of the Dashboard will display a number of options:
-
Collapse: Collapse the tile for readability.
-
Configure Profile: Select the Advanced Search Profile to use in the widget (see Configuration of Dashboards setup below).
-
Export Page to PDF/Excel: Exports the page 1 data to PDF/Excel format.
-
Export All: Exports the entire search profile dataset to Excel.
-
Refresh Data: Refreshes the data being displayed in the table.
Charts
An example chart tile looks like the following (this comes from the Chart setup within an Advanced Search Profile).
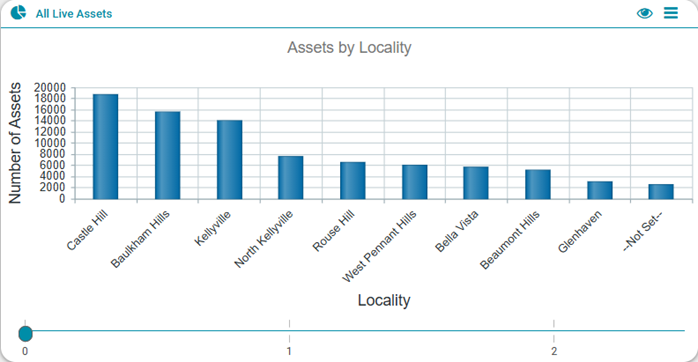
NOTE When the user displays both a Chart and Tabular data that originates from the same Search Profile (e.g. on a Dashboard page), they can select a data series on the chart and it will filter the Tabular data being displayed.
Selecting on the Eye Icon ( ) in the top right corner of the dashboard will take the user to the Dashboard page of the source Advanced Search Profile so that the data sitting behind the chart can be viewed.
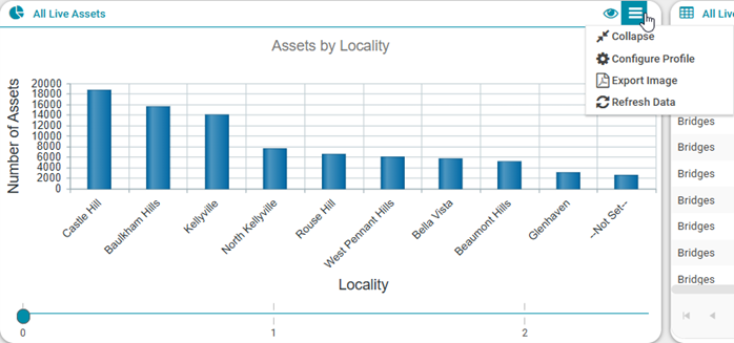
Clicking the " " icon in the top right of the Dashboard will display a number of options:
-
Collapse: Collapse the tile for readability.
-
Configure Profile: Select the dashboard tile from an Advanced Search Profile (see Configuration of Dashboards setup below).
-
Export Image: Exports an Image of the chart.
-
Refresh Data: Refreshes the chart data that is being displayed.
Configuration of Dashboard Widgets
When the configuration Cog ( ) is selected on any dashboard a screen will display similar to the following:
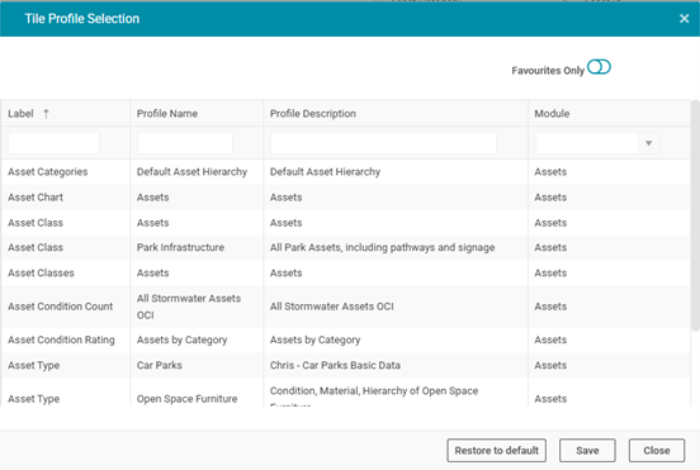
Key things to note when assigning a dashboard widget:
-
The Favourites Only toggle is used to show only favourites (or show all Profiles)
-
The user can enter a search term (e.g. a word in the profile name) and hit enter to limit the Profile results
-
Selecting the Arrow button to expand a search profile so any available widgets will be displayed (this is required when assigning KPI/Chart/Map widgets to a dashboard tile)
NOTE There is a "Contextual" option  for dashboards on a number of pages that automatically applies further data filters in the context of that page. This ensures that the user does not have to create an excessive amount of Advanced Search Profiles. Eg: The user might create an Advanced Search that returns all assets, but when viewing a particular Asset Category/Asset Record the Contextual filter limits the data displayed (i.e. I will only see records for the currently selected Asset Category/Asset Record).
For all Dashboard pages where the Contextual setting is available the following toggle is available when configuring user Dashboards:
-
In the above example, the Contextual setting has been set to "On", so that only records that relate to the context of this particular page will be displayed.
-
Note that if a user configures the system default Asset Attribute widget on an Asset's home dashboard, the same search profile will apply to that widget for all Assets regardless of the Asset Category. This is because that specific widget is a shared widget across all Assets.
-
In order to show a Search Profile for Assets in just the chosen Category, users need to edit the Dashboard layout, remove the default Attribute widget, add a new Attribute widget in it's place, and save the Dashboard with a new name.
